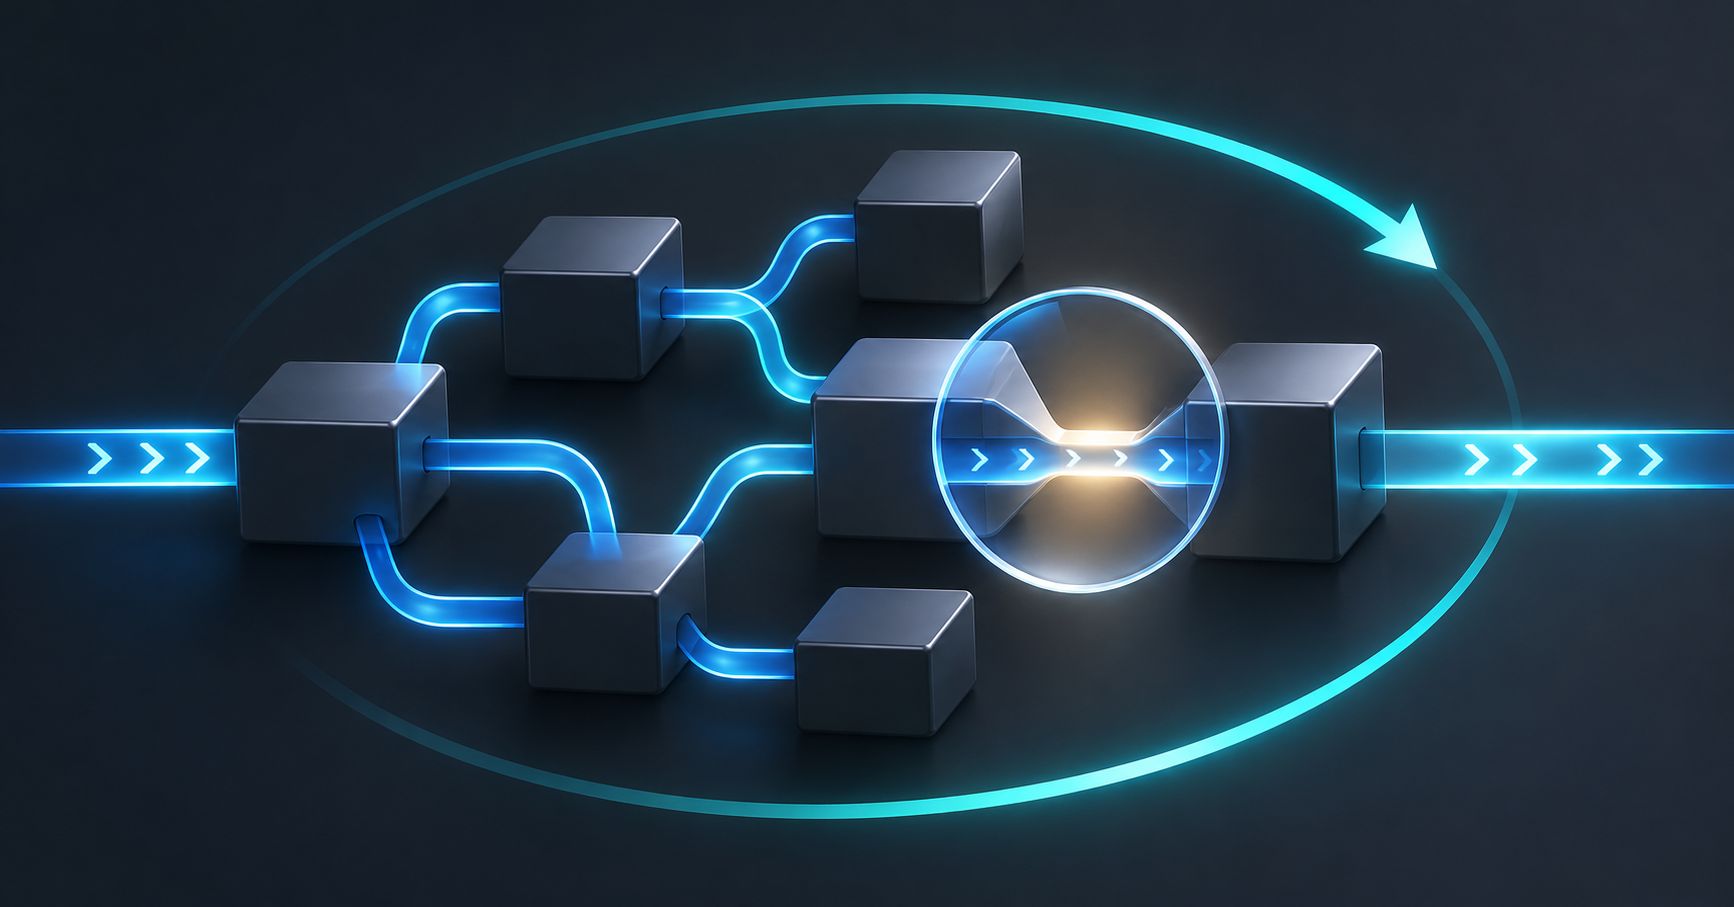
Instrumenting a technology environment helps a company understand application behavior, target fixes and evaluate the results of each improvement.
Can your company identify where an operation loses time when demand increases?
For someone using a system, the symptom is often clear: a page takes too long to load, a request remains pending or a process runs longer than expected. For the team responsible, finding the source of that slowdown can be much harder.
An operation may pass through several services, message queues and databases. Without information that makes this journey visible, investigations depend on scattered records, individual knowledge and hypotheses that are not always easy to confirm.
This is where observability can make a difference: helping teams understand what happens inside applications and use that knowledge to guide improvements.
Make the journey of an operation visible
Knowing that an application is available answers only part of the question. We also need to understand how it behaves while serving the business.
Where does processing slow down? At which step do errors occur? What changes when request volume increases?
Instrumentation means preparing systems to produce information that helps answer these questions. This includes:
- Metrics: measurements such as operation volume, processing duration and error counts.
- Logs: event records that provide context about application behavior.
- Traces: records that follow the steps of an operation across different components.
This information becomes valuable when it helps the team connect a symptom experienced by a user to the part of the system that needs attention.
A bottleneck during peak demand
A practical example illustrates this relationship.
In an application built with Python services, one component sent messages to an AWS SQS queue while another consumed them. During peak demand, delays appeared in this flow.
Instrumenting both services with OpenTelemetry made the message journey more visible and helped focus the investigation. The analysis identified a loop that repeatedly created database connection pools: structures used to manage the connections an application relies on.
The evidence was documented and shared with the development and database teams. After the fix, the bottleneck was no longer observed during application traffic peaks.
The outcome illustrates an important sequence: observe behavior, locate the problem, gather evidence, apply a fix and follow up on its effect.
Instrumentation helped the investigation move from a general perception of slowness to a specific problem the teams could act on.
Build a foundation for investigation
For this kind of diagnosis to become routine, information collection needs to be organized.
This involves defining how applications generate data and how that data is collected, processed and made available for analysis. It also means taking care of collection agent deployment, log organization, dashboards and alerts.
Tools such as Datadog and OpenTelemetry can support this setup. Terraform allows observability configurations to be defined as code, making them easier to standardize, review and reproduce.
Tool selection should follow the questions the company needs to answer. A dashboard becomes useful when it helps people understand a condition that matters to operations. An alert should signal a situation that calls for investigation or action.
Implementation can therefore start with a business-critical flow: a customer request, an integration or a process that frequently experiences delays. From that starting point, the team defines the information it needs and expands coverage as it learns.
Protecting data is part of the work
As visibility into applications grows, teams need to consider the information being recorded.
Logs may contain sensitive data inadvertently included during development. An observability setup should include rules to identify and mask this information, alongside guidance on what teams should record.
These considerations belong in the instrumentation process from the beginning. The aim is to provide enough context to investigate problems, with clear criteria for collecting, accessing and using data.
Cultural change starts in development
Keeping this work going depends on the people who understand and develop the applications.
When developers learn to create metrics and traces for their own routines, observability becomes part of building software. During development, the team starts considering how it will verify a feature’s behavior once it reaches production.
A few questions help establish this practice:
- How will we know whether this routine is working as expected?
- How will we identify a delay or failure?
- What information will we need to investigate?
- How will we verify the effect of a fix?
Sharing this knowledge expands the team’s ability to investigate. It also makes collaboration easier: an issue can be handed to development, infrastructure or database teams with evidence that supports the analysis.
This is a cultural change that begins with practical actions: instrument a flow, analyze its signals, document a finding and share what the team has learned.
Turn findings into continuous improvement
For managers, observability can provide a more concrete basis for prioritizing technical work.
Understanding where an operation loses time and which conditions accompany a failure makes it easier to discuss what to investigate first and which results to track after a change.
Not every problem requires a new tool or additional infrastructure. Analysis may point to changes in code, connection management, message processing or service configuration. Evidence helps teams choose an intervention that fits the problem they have found.
Follow-up closes the loop. In the Python services example, the absence of the bottleneck during peaks after the fix was the observed evidence that the change had achieved its intended effect.
Instrumenting the technology environment provides a foundation for repeating this process. With useful information and teams prepared to interpret it, a company develops an ongoing ability to find problems, target fixes and learn from the actual behavior of its applications.
A good starting point is to choose an operation that matters to the business and ask: can we follow its journey today and explain where it loses time?